LLM as Planner for Kubernetes Autoscaling: Contextual Fault-Gating and Lead-Time Forecasting (Part 2)
Layer Decision Tree fault-gates and quantile GBDT forecasters upstream of native Kubernetes autoscaling/v2, preventing downstream connection storms and reducing cold-start lag as a complement to baseline capacity recommenders.
TL;DR
-
The Problem: Native Kubernetes HPA's
max()actuator triggers fatal connection storms during shared-state database brownouts (threads spike while CPU drops), and its reactive logic lags by 30 to 60 seconds on slow-starting runtimes. - Layer 1 (Contextual Fault-Gate): A shallow Decision Tree evaluates dependency wait z-scores in sub-milliseconds, inhibiting thread-based scale-out when shared databases stall while allowing normal scale-out for genuine ingress or elastic I/O wait.
- Layer 2 (Quantile Forecaster): A GBDT trained with pinball loss ($q = 0.90$) on retry-stripped arrivals and upstream funnel indicators provides HPA with an early-warning replica floor ahead of container startup.
- The LLM's Role: The LLM never makes live scaling decisions. It runs as an offline batch planner, analyzing OpenTelemetry trace graphs to synthesize configuration schemas, feature sets, and safety thresholds for the fast runtime ML solvers.
In our previous post on LLM as Planner for Classic ML (Part 1), we showed how pairing a Generative AI planner with a deterministic classical solver delivers sub-millisecond execution, human-readable rules, and governed adaptation to drift.
In Kubernetes autoscaling, platform teams typically build a slow-loop baseline recommender first: an offline job that analyzes a rolling week of production and load-test telemetry every few days, coordinates vertical pod requests with horizontal bounds, and opens pull requests for developer approval. That baseline layer is essential: it stops Horizontal Pod Autoscaler (HPA) and Vertical Pod Autoscaler (VPA) from fighting over the same CPU utilization denominator and eliminates manual YAML guesswork.
However, once that baseline foundation is in place, fast-loop runtime scaling is still delegated to standard Kubernetes autoscaling/v2 (and KEDA). Modern autoscaling/v2 is a capable proportional controller: it supports per-container CPU (ContainerResource), ignores unready warming pods, enforces scale-up/scale-down behavior rate limits, and takes the max() across custom metrics like busy threads or queue depth.
Even with well-tuned behavior policies and connection pool budgets, native multi-metric HPA still hits two runtime edge cases: context-blind max() scaling during downstream brownouts and reactive lag on slow-starting runtimes. By placing lightweight, verifiable classical ML models upstream of native HPA, and using an offline LLM Planner to configure them from distributed trace topologies, we can address both failure modes without replacing Kubernetes' battle-tested proportional actuator.
Where Tuned autoscaling/v2 Needs Upstream Context
Standard multi-metric HPA evaluates each configured signal independently and selects the highest replica count:
$$ \hat{N}_t = \max_{m \in \mathcal{M} } \left\lceil N_{t,\text{ready} } \cdot \frac{s_m(t)}{\theta_m} \right\rceil $$
When paired with rate-limited behavior.scaleUp policies and PgBouncer/HikariCP connection limits, this works for the majority of workloads. Two runtime scenarios expose its limits:
1. The max() Backpressure Dilemma: Shared-State Bottlenecks vs. Elastic I/O
Because max() acts as an unconditional OR gate, it cannot distinguish why worker threads or concurrency spiked, nor can it distinguish which downstream dependency is slow:
- Shared-State / Capacity-Bound Dependencies (e.g., Primary Relational DB, Stateful Legacy Service): Suppose a Postgres primary experiences lock contention. In the calling JVM service, app-container CPU drops to $18\%$ because threads block on socket reads, while
jvm_busy_threads_pctclimbs to $95\%$. Even withbehavior.scaleUprate limits, standard HPA sees saturated threads and steps replicas up towardmaxReplicas. Every new pod initializes another connection pool and adds retry pressure against the struggling database. - Elastic / Rate-Unaffected External APIs (e.g., Third-Party Webhook or Stateless SaaS API): Conversely, if an external API slows down from $50\text{ms}$ to $800\text{ms}$ per call without capacity degradation on its side, holding more concurrent waiting threads in the calling service is useful so incoming requests aren't rejected by local thread-pool exhaustion.
A single concurrency metric fed into max() cannot tell these two situations apart.
2. Cold-Start Actuation Lag ($\tau_{\text{startup} }$) on Predictable Ramps
HPA reacts to telemetry at time $t_0$. When a container takes $\tau_{\text{startup} } = 45\text{s}$ to schedule, initialize, and pass readiness probes, reactive scaling behaves differently depending on the traffic shape:
- Known Calendar Events (Flash Sales, Tax Deadlines): Best solved deterministically with scheduled replica floors (e.g., KEDA cron triggers), not ML.
- Unannounced Instantaneous Step Jumps: If traffic jumps $5\times$ in two seconds without warning, no predictor can beat the physical $\tau_{\text{startup} }$ barrier; only over-provisioned headroom or fast startup times help.
- Organic Ramps and Upstream Funnel Cascades: In many production surges, checkout or API load ramps over 2–10 minutes, or is preceded by upstream leading indicators (login velocity, edge queue arrivals, cart additions) 30–90 seconds earlier. Standard HPA waits until local CPU or threads cross $\theta_m$ before requesting pods, wasting valuable lead time.
Progressive Architecture: Rules First, Learned Solvers Where Needed
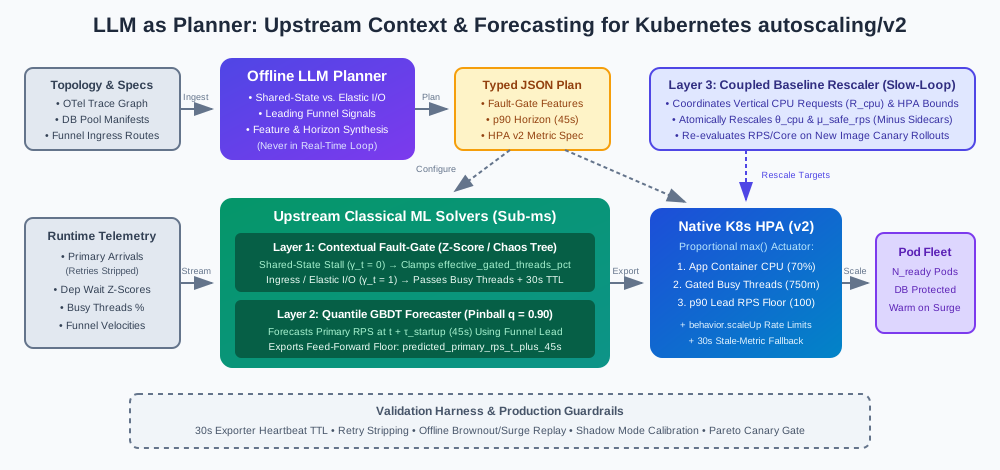
autoscaling/v2 with a 30s heartbeat TTL.Rather than replacing HPA or building a monolithic ML controller, we layer three components upstream of autoscaling/v2 in order of operational return on investment:
- Layer 1: Contextual Fault-Gate (
effective_gated_threads_pct): Suppresses thread-based scale-out when saturation is caused by a degrading shared-state dependency, while allowing scale-out during genuine ingress demand or elastic external I/O wait. - Layer 2: Quantile Lead-Time Forecaster (
predicted_primary_rps_at_startup): Uses asymmetric quantile loss ($q = 0.90$) on retry-filtered primary arrivals and upstream funnel velocities to provide HPA with a feed-forward replica floor $\tau_{\text{startup} }$ seconds ahead. - Layer 3: Coupled Baseline Rescaler: Ensures that whenever the slow-loop baseline updates vertical CPU requests ($R_{\text{cpu} }$), both the horizontal CPU target ($\theta_{\text{cpu} }$) and the nominal per-pod throughput constant ($\mu_{\text{safe\_rps} }$) rescale atomically.
Mathematical Formulation
1. The Contextual Fault-Gate (Rule Baseline → Chaos-Trained Decision Tree)
Start with a deterministic rule: Before introducing a learned model, platform teams should deploy a simple baseline gate using per-service rolling z-scores. For a service with historical mean wait share $\mu_{\text{wait} }$ and standard deviation $\sigma_{\text{wait} }$ across its shared-state dependencies:
$$ z_{\text{wait} }(t) = \frac{W_{\text{shared\_dep} }(t) / W_{\text{svc} }(t) - \mu_{\text{wait} } }{\sigma_{\text{wait} } } $$
Using $z_{\text{wait} }(t)$ instead of a hardcoded ratio (like $0.80$) prevents false positives on I/O-heavy orchestrators whose normal baseline wait share is already $0.90$.
When to upgrade to a Decision Tree: If you define the training label as a deterministic formula of two features (z_wait > 3.0 AND ingress_delta <= 0), training a Decision Tree on those same features is circular: the tree merely memorizes your formula. A learned DecisionTreeClassifier only adds value when trained on external ground-truth labels that a static two-variable rule misses:
- Staging Fault-Injection / Chaos Campaigns: Injecting graded latency, packet loss, and connection pool saturation into specific dependencies via Istio/Toxiproxy while varying upstream load, recording whether adding replicas reduced or worsened end-to-end SLO error burn.
- Annotated Incident Windows: Historical brownouts labeled by whether scale-out caused downstream connection pool exhaustion or retry amplification.
Trained on those non-circular outcomes, a shallow tree (max_depth: 3) classifies the current state vector $x_t$ into a gating coefficient $\gamma_t \in \{0, 1\}$ with split-threshold hysteresis ($\tau_{\text{out} }, \tau_{\text{in} }$). The exported concurrency metric is:
$$ \tilde{\psi}_{\text{gated} }(t) = \gamma_t \cdot \psi_{\text{threads} }(t) + (1 - \gamma_t) \cdot \theta_{\text{threads} } \cdot \min\left(1.0,\; \frac{\lambda_{\text{in} }^{\text{primary} }(t)}{N_{t,\text{ready} } \cdot \mu_{\text{safe\_rps} } }\right) $$
- During Ingress Load or Elastic External I/O ($\gamma_t = 1$): $\tilde{\psi}_{\text{gated} }(t) = \psi_{\text{threads} }(t)$, allowing HPA to scale out normally within its
behavior.scaleUprate limits. - During Shared-State Dependency Stall ($\gamma_t = 0$): When a shared-state database stalls, $\tilde{\psi}_{\text{gated} }(t)$ clamps to primary non-retry arrival demand, preventing HPA from opening hundreds of new database connections while keeping enough pods running to serve actual arrivals.
Exporter Heartbeat & Stale-Metric Protection
Kubernetes HPA refuses to scale in if a custom metric endpoint becomes unreachable, and falls back to remaining valid metrics during scale-out. However, if a healthy metric adapter keeps serving a stale cached value where $\gamma_t = 0$, it could silently suppress legitimate thread-based scale-out.
To prevent silent suppression, the fault-gate exporter attaches a strict Time-To-Live (maxMetricAge: 30s) heartbeat. If the feature pipeline stalls or misses two consecutive ticks, the adapter drops effective_gated_threads_pct and substitutes raw jvm_busy_threads_pct capped by HPA's native scaleUp stabilization policy.
2. Retry-Filtered, Quantile-Loss Lead-Time Forecasting
Using raw ingress RPS $\lambda_{\text{in} }(t)$ as ground truth has a hidden trap: during a partial outage, clients and upstream meshes automatically retry failed requests, inflating measured ingress by $2\times$ to $5\times$. Forecasting raw ingress trains the model to predict (and scale into) retry storms.
Step A: Strip Client Retries for True Primary Demand
We filter ingress telemetry at the edge/mesh layer to isolate first-attempt primary arrivals $\lambda_{\text{in} }^{\text{primary} }(t)$ (requests where x-envoy-attempt-count == 1 or without duplicate idempotency tokens).
Step B: Train with Asymmetric Quantile (Pinball) Loss
Because steep traffic ramps are rare compared to flat steady-state periods, a GBDT trained with standard Mean Squared Error (MSE) regresses toward the mean ($\hat{r}_t \approx 0$), systematically underpredicting spikes. Furthermore, the business cost is asymmetric: slightly over-forecasting for 3 minutes costs pennies in pod-minutes, whereas under-forecasting causes SLA breaches.
We train the GBDT on the log-growth ratio $r_{t,\tau} = \ln\left(\frac{\lambda_{\text{in} }^{\text{primary} }(t + \tau_{\text{startup} })}{\lambda_{\text{in} }^{\text{primary} }(t)}\right)$ using pinball loss at quantile $q = 0.90$:
$$ \mathcal{L}_q(r, \hat{r}) = \max\big(q(r - \hat{r}),\; (q - 1)(r - \hat{r})\big) $$
The model ingests primary arrival velocities ($\Delta \lambda_{\text{in} }^{\text{primary} }$), upstream funnel leading indicators $u_{\text{funnel} }(t)$ (such as authentication/session-start rates or cart-initiation rates that precede checkout calls), and cyclical calendar encodings $c_t$:
$$ \hat{\lambda}_{\text{lead} }^{(p90)}(t) = \lambda_{\text{in} }^{\text{primary} }(t) \cdot \exp\Big(\gamma_t \cdot f_{\text{GBDT} }^{(p90)}\big(\Delta \lambda_{\text{in} }^{\text{primary} }(t),\; u_{\text{funnel} }(t),\; c_t\big)\Big) $$
Multiplying by $\gamma_t$ ensures that if the service is in a downstream stall ($\gamma_t = 0$), the forecaster defaults to current primary arrivals without speculative amplification. And because a tree ensemble’s output $f_{\text{GBDT} }^{(p90)}$ is bounded by the largest log-ratio observed in training ($r_{\max}$), this term acts strictly as an early-warning feed-forward floor, while HPA's reactive CPU and thread ratios remain unbounded above it:
$$ \hat{N}_t = \max\left( \left\lceil N_{t,\text{ready} } \cdot \frac{u_{\text{app, ready} }(t)}{\theta_{\text{cpu} } } \right\rceil, \left\lceil N_{t,\text{ready} } \cdot \frac{\tilde{\psi}_{\text{gated} }(t)}{\theta_{\text{threads} } } \right\rceil, \left\lceil \frac{\hat{\lambda}_{\text{lead} }^{(p90)}(t)}{\mu_{\text{safe\_rps} } } \right\rceil \right) $$
3. Coupled Vertical Rescaling Across All Constants
When the slow-loop baseline recommender updates a pod's vertical CPU request from $R_{\text{cpu} }^{\text{old} }$ to $R_{\text{cpu} }^{\text{new} }$ (accounting for both the app container and P99 sidecar overhead $U_{\text{sidecars} }$, and using Tobit censored regression so CFS-throttled high-load windows aren't discarded), both the relative CPU target and the per-pod safe throughput constant must rescale together:
$$ \theta_{\text{cpu} }^{\text{new} } = \theta_{\text{cpu} }^{\text{old} } \cdot \frac{R_{\text{cpu} }^{\text{old} } }{R_{\text{cpu} }^{\text{new} } }, \qquad \mu_{\text{safe\_rps} }^{\text{new} } = \mu_{\text{safe\_rps} }^{\text{old} } \cdot \frac{R_{\text{cpu} }^{\text{new} } - U_{\text{sidecars} } }{R_{\text{cpu} }^{\text{old} } - U_{\text{sidecars} } } $$
Additionally, whenever a new container image digest deploys, the harness re-evaluates empirical RPS-per-core during canary rollout so $\mu_{\text{safe\_rps} }$ never drifts if a code change makes an endpoint more CPU-intensive.
Why an LLM Planner Earns Its Place
The LLM Planner is never in the real-time loop. Its job is automated topology interpretation and configuration synthesis across hundreds of microservices whenever service graphs or schemas evolve.
Specifically, the LLM Planner reads a service’s OpenTelemetry dependency graph, database connection pool manifests, and upstream ingress routes to classify which downstream dependencies are shared-state bottlenecks (e.g., Postgres, Redis, legacy monoliths) versus elastic external APIs, and which upstream routes serve as leading funnel indicators:
{
  "task": "configure_hpa_fault_gate_and_quantile_forecaster",
  "service_id": "checkout-orchestrator",
  "runtime_detected": "jvm_tomcat",
  "measured_p95_startup_sec": 45,
  "nominal_pod_capacity": {
    "app_cpu_request_m": 2000,
    "target_cpu_utilization_pct": 70,
    "safe_rps_per_pod_at_target": 100
  },
  "otel_dependency_classification": [
    {
      "service": "orders-postgres-primary",
      "category": "shared_state_bottleneck",
      "action_on_stall": "inhibit_thread_scale_out"
    },
    {
      "service": "tax-calculation-saas-api",
      "category": "elastic_external_io",
      "action_on_stall": "allow_bounded_scale_out_up_to_pool_cap"
    }
  ],
  "upstream_funnel_signals": [
    "edge_auth_token_issue_rps",
    "cart_summary_view_rps"
  ],
  "fault_gate_config": {
    "mode": "chaos_trained_decision_tree",
    "max_depth": 3,
    "exporter_ttl_sec": 30,
    "features": [
      "primary_non_retry_rps_delta",
      "jvm_tomcat_busy_threads_pct",
      "shared_state_dep_wait_zscore",
      "elastic_dep_wait_zscore",
      "shared_state_dep_5xx_rate"
    ]
  },
  "lead_forecaster_config": {
    "algorithm": "LightGBMQuantileRegressor",
    "loss_function": "quantile_pinball",
    "quantile_alpha": 0.90,
    "horizon_sec": 45,
    "target": "log_primary_rps_ratio_t_plus_45s"
  },
  "hpa_v2_spec": {
    "min_replicas": 10,
    "max_replicas": 80,
    "behavior": {
      "scaleUp": {
        "stabilizationWindowSeconds": 0,
        "maxPercentIncreasePer15s": 50
      },
      "scaleDown": {
        "stabilizationWindowSeconds": 300
      }
    },
    "metrics": [
      {"type": "ContainerResource", "container": "app", "name": "cpu", "target_utilization": 70},
      {"type": "Pods", "name": "effective_gated_threads_pct", "target_average_value": "750m"},
      {"type": "External", "name": "predicted_primary_rps_t_plus_45s", "target_average_value": "100"}
    ]
  }
}
Concrete Walkthrough: Calibrated Numbers Across Both Scenarios
Consider our checkout-orchestrator service with the following calibrated baseline:
- Pod Calibration: Each Ready pod has $2000\text{m}$ app CPU request and hits the $70\%$ CPU target ($\theta_{\text{cpu} } = 0.70$) at exactly $\mu_{\text{safe\_rps} } = 100\text{ RPS/pod}$ ($0.70\%\text{ CPU per RPS}$, with $100\%\text{ CPU}$ at $143\text{ RPS/pod}$).
- Initial Steady State ($t = 0\text{s}$): $N_{0,\text{ready} } = 10\text{ pods}$ serving $\lambda_{\text{in} }^{\text{primary} }(0) = 800\text{ RPS}$ ($80\text{ RPS/pod} \implies 56\%\text{ CPU}$ and $45\%$ busy threads).
- Startup Lag: $\tau_{\text{startup} } = 45\text{ seconds}$ from pod creation to passing readiness probes.
Scenario A: Shared-State Database Brownout (With Rate-Limited HPA Baseline)
At 2:00 PM, orders-postgres-primary experiences lock contention, pushing query latency from $15\text{ms}$ to $2{,}500\text{ms}$.
- Primary Arrivals ($\lambda_{\text{in} }^{\text{primary} }$): Flat at $800\text{ RPS}$ ($80\text{ RPS/pod}$), though raw ingress including client retries jumps to $1{,}900\text{ RPS}$.
- App Container CPU: Drops from $56\%$ to $18\%$.
- Tomcat Busy Threads: Spikes from $45\%$ to $96\%$.
- Shared-State Wait Z-Score ($z_{\text{wait} }$): Jumps to $+6.4$.
| Autoscaler Architecture | Action Taken | Operational Outcome |
|---|---|---|
| Single-Metric CPU HPA | Sees $18\%$ CPU and scales in after the $300\text{s}$ stabilization window toward fewer pods. | Thread exhaustion; drops legitimate requests that could have succeeded. |
Tuned Multi-Metric HPA (max(cpu, threads) + scaleUp limits) |
Sees $96\%$ busy threads via max() and steps replicas up by $50\%$ every $15\text{s}$ ($10 \to 15 \to 23 \to 35 \dots \to 80\text{ pods}$). |
Opens 70 new connection pools against the locked Postgres primary; requires PgBouncer saturation to stop DB collapse. |
| Fault-Gated HPA ($\gamma_t = 0$) | Sees $z_{\text{wait} } = +6.4$ on a shared_state_bottleneck with flat primary RPS ($\lambda_{\text{in} }^{\text{primary} } = 800\text{ RPS}$). Sets $\tilde{\psi}_{\text{gated} }$ to $\frac{800}{10 \times 100} \times 0.75 = 0.60$. |
Holds fleet steady at 10 pods, preserving capacity for the 800 primary RPS without adding a single extra DB connection. |
(Note: If the stall had occurred on tax-calculation-saas-api, which is classified as elastic_external_io, the fault gate keeps $\gamma_t = 1$, allowing HPA to add pods up to the configured ceiling so extra worker threads can absorb the higher I/O wait time.)
Scenario B: Organic Funnel-Led Surge ($800\text{ RPS} \to 3{,}500\text{ RPS}$)
Suppose an unscheduled viral event sends a wave of users into the app. Because users authenticate and view their carts before hitting checkout-orchestrator, upstream funnel metrics (cart_summary_view_rps) and primary arrival acceleration rise ahead of checkout saturation:
- At $t = 0\text{s}$: 10 pods serving $800\text{ RPS}$ ($80\text{ RPS/pod}$, $56\%$ CPU).
-
At $t = 15\text{s}$ (Pre-Saturation Lead Trigger): Checkout traffic has risen modestly to $950\text{ RPS}$ ($95\text{ RPS/pod} \implies 66.5\%\text{ CPU}$, still below the $70\%$ CPU HPA threshold). Reactive HPA does nothing yet. However, the 90th-percentile GBDT forecaster detects the sharp acceleration in
cart_summary_view_rpsand $\Delta \lambda_{\text{in} }^{\text{primary} }$, outputting a 45-second forecast of:$$ \hat{\lambda}_{\text{lead} }^{(p90)}(t + 45\text{s}) = 2{,}400\text{ RPS} $$
Dividing by $\mu_{\text{safe\_rps} } = 100\text{ RPS/pod}$, HPA immediately computes $\lceil 2{,}400 / 100 \rceil = 24\text{ pods}$ and launches new replicas at $t = 15\text{s}$ (governed byscaleUprate limits: $10 \to 15\text{ pods}$ at $t = 15\text{s}$, $15 \to 23\text{ pods}$ at $t = 30\text{s}$, $23 \to 24\text{ pods}$ at $t = 45\text{s}$). - At $t = 22\text{s}$: Checkout traffic crosses $1{,}000\text{ RPS}$ ($70\%$ CPU), where standard reactive HPA would have just started requesting its first batch of pods.
- At $t = 60\text{s}$ (First Forecasted Batch Becomes Ready): Checkout traffic reaches $2{,}350\text{ RPS}$. The pods launched at $t = 15\text{s}$ complete their 45-second JVM startup and pass readiness probes, bringing Ready capacity to 15 pods (and 23 pods by $t = 75\text{s}$), cutting peak thread saturation duration by 45 seconds compared to purely reactive HPA.
Validation Harness: Offline Action Verification + Shadow Mode
Historical trace replay cannot prove how adding replicas would have altered closed-loop latency or downstream database contention without a full queueing simulator. Therefore, promotion uses a two-stage gate with strict Pareto dominance (a Challenger may never trade worse SLA compliance for lower cost):
-
Stage 1: Offline Controller Action Verification: Replays historical brownout and surge traces to verify deterministic invariants:
- Did $\gamma_t$ switch to $0$ within one tick of every labeled shared-state dependency brownout?
- Did $\hat{\lambda}_{\text{lead} }^{(p90)}$ ignore client retry amplification during outages?
- Is the policy monotonically non-decreasing with respect to primary arrivals when $\gamma_t = 1$?
-
Stage 2: Shadow Mode & Canary Promotion: The Challenger exporter runs in shadow mode in production (computing $\tilde{\psi}_{\text{gated} }$ and $\hat{\lambda}_{\text{lead} }^{(p90)}$ into Prometheus without wiring them to HPA) to measure forecast calibration (90% coverage check) and false-gate rate. Once shadow checks pass, it promotes to a canary deployment where it must achieve:
$$ \Delta \text{SLA}_{\text{violation\_sec} } \le 0 \quad \textbf{AND} \quad \left(\Delta \text{PodCoreHours} \lt 0 \;\lor\; \Delta \text{DBConnections}_{\text{brownout} } \lt 0\right) $$
Operational Architecture: From Telemetry to Actuation
Setting up this architecture in a production Kubernetes environment moves beyond standard reactive scaling by separating slow-loop offline planning from fast-loop runtime execution. Here is how platform teams operationalize the LLM Planner, Decision Tree fault-gates, and Quantile GBDT forecasters alongside native Kubernetes autoscaling/v2:
1. Establishing the Telemetry Foundation
Before deploying any machine learning or rules, the telemetry pipeline must capture both local container CPU and upstream dependency context:
- Distributed Tracing (OpenTelemetry / Jaeger): Maps caller-to-callee relationships so the platform knows which database or legacy service a thread pool is waiting on.
- Custom Metrics (Prometheus): Exposes fine-grained runtime metrics (such as
jvm_busy_threads_pct, connection pool saturationhikari_connections_active, and upstream ingress arrival rates $\lambda_{\text{in} }$) scraped every 5 to 15 seconds.
2. Running the Offline LLM Planner
The Large Language Model never runs in the live request path. Instead, it operates as a periodic batch job (such as a weekly cron or triggered whenever service dependency graphs change):
- Trace Analysis: The LLM inspects OpenTelemetry dependency graphs and historical incident post-mortems.
- Schema & Rule Generation: It identifies shared-state bottlenecks (such as isolating which PostgreSQL primary causes thread blocking) and emits typed configuration manifests (JSON/YAML) defining feature weights and safety thresholds for upstream classifiers.
3. Deploying the Classical ML Solvers
Lightweight classical models (compiled into a fast sidecar or custom metrics exporter written in Go) consume the LLM’s configuration and real-time telemetry:
- The Decision Tree Fault-Gate: Trained on historical chaos engineering logs (such as Istio-injected latency or connection limits) and incident windows. Evaluates current feature vectors $x_t$ (like wait-share z-scores) in under a millisecond to output a binary gating coefficient $\gamma_t \in \{0, 1\}$. If $\gamma_t = 0$, it clamps the concurrency metric fed to HPA, preventing connection storms during a database brownout.
- The Quantile GBDT Forecaster: Uses gradient boosting with asymmetric quantile loss ($q = 0.90$) to predict future traffic demand $\tau_{\text{startup} }$ seconds in advance based on upstream funnel metrics (like edge queue arrivals).
4. Serving via Custom Metrics Exporter & Prometheus Adapter
The output of these classical solvers feeds directly into Kubernetes autoscaling/v2:
- Custom Exporter Sidecar: A lightweight sidecar fetches raw Prometheus metrics, runs the low-latency Decision Tree and GBDT models in memory, and exposes synthetic metrics like
effective_gated_threads_pctandpredicted_primary_rps_at_startup. - Prometheus Adapter: Exposes these custom metrics to the Kubernetes API server (
custom.metrics.k8s.io). - Horizontal Pod Autoscaler (HPA): Configured with a short heartbeat TTL (such as 30 seconds) to consume these upstream-gated metrics alongside standard CPU utilization, safely driving replica counts via
autoscaling/v2.
Rollout Order: How to Adopt This Incrementally
These runtime components complement, rather than replace, a slow-loop baseline recommender. If you are building or upgrading a platform autoscaler, deploy in this order:
- Baseline Foundation First: Configure native
autoscaling/v2with per-container CPU (ContainerResource), sensiblebehavior.scaleUprate limits, connection pool budgets, and a slow-loop vertical/horizontal baseline recommender. - Add the Contextual Fault-Gate in Shadow Mode: Start with a simple z-score rule ($z_{\text{wait} } \gt 3.0 \land \Delta \lambda_{\text{in} }^{\text{primary} } \le 0$) on shared-state dependencies with a 30-second exporter heartbeat TTL. Upgrade to a chaos-trained Decision Tree only for services with complex multi-dependency interactions.
- Add the Quantile Forecaster for Slow-Starting Services: For runtimes with $\tau_{\text{startup} } \gt 30\text{s}$ and observable upstream funnel signals, deploy the retry-filtered p90 GBDT forecaster as an
Externalfloor metric alongside KEDA cron schedules for known calendar events.